Overview
In this article, we will review the dashboard (activities) tab on the Activity and People Analytics.
Dashboard (Activities) Tab
The activities tab shows the dashboard of the Activity and People Analytics. This section will show an overview of what activities are happening in the system listed by location, date, type, and user.

Date Pick vs. Date Range
The report date will default to rolling 13 months, this can be changed under the Date Pick section or the Date Range section.
 Date Pick
When selecting a date range, the start date needs to be before the end date. We recommend starting with the end date before selecting the start date if needed.

Date Range
Quick Tip: To type in the date range section, select a random date then a curser will be present to type the date in this section.
Activities Completed
The activities completed section on the activities tab will give an overview on all completed activities during the date filtered by region, location and date. A user can right click on a number to drill through to see the list of individuals listed for that section.


Right click on the number to drill through to the list of individuals.

Once drilled through, a list will appear for those individuals that fall under that category.
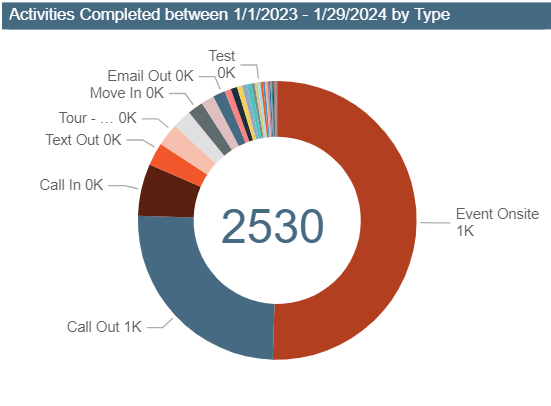
Activities Completed by Type
The activities completed by type chart shows all activities that have been completed during the date filtered based on the type of activity. When this section is clicked on, it will manipulate the report to show only what activity type was clicked on. For example, if Event Onsite was clicked on, this will manipulate the report to show data for that activity type.
Activities Completed Graph
The activities completed graph will show all completed activities based on the date filtered. The graph will spike when more activities are completed based on that month.

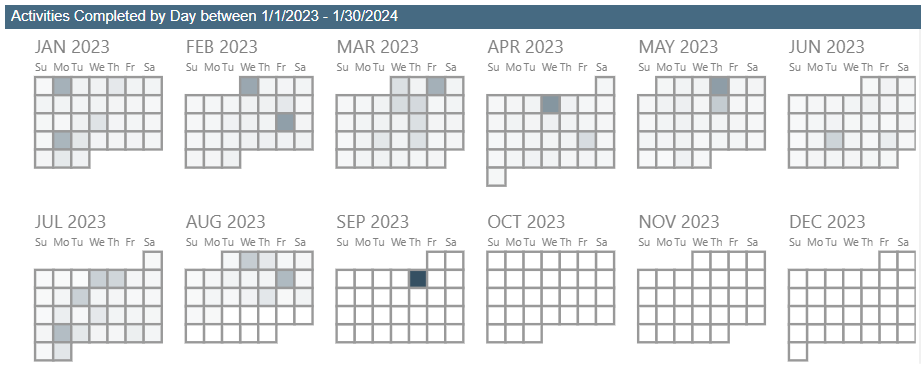
Activities Completed by Day Heat Map
This section will show all completed activities based on the month and date. The darker the color the higher amount of activities were completed on that date. This section is a great view to see productivity based on month and date.
Logic Page
The logic page will give an overview on how the data is collected and displayed in the reporting.

Was this article helpful?
That’s Great!
Thank you for your feedback
Sorry! We couldn't be helpful
Thank you for your feedback
Feedback sent
We appreciate your effort and will try to fix the article